Oil Shock Stress Test: How SPY, QQQ, VXUS, and AVUV React to Energy Crises
We use historical stress testing to show how oil shocks move through inflation, rates, margins, geography, and factor exposure across four major ETFs.
In the global economy, energy is the base-layer infrastructure. When oil prices experience a violent spike due to geopolitical conflict, the resulting inflation and supply chain friction act as a massive drag on corporate profits.
However, growth stocks, broad market indexes, international equities, and small-cap value funds all react to these inflationary spikes differently based on their sector weighting and geographic exposure.
Why this matters
Oil shocks do not only affect energy stocks. They can raise inflation expectations, pressure consumer spending, change central bank policy expectations, and create very different outcomes across growth, value, international, and broad-market ETFs. The goal is not to predict the next war or oil spike, but to understand which parts of a portfolio are most exposed when energy becomes expensive.
How oil shocks hit portfolios
Oil shocks usually affect portfolios through five channels:
- Inflation: higher fuel and transportation costs feed into prices
- Rates: central banks may delay cuts or tighten policy
- Margins: companies with high energy or logistics costs face pressure
- Consumer demand: households spend more on fuel and less elsewhere
- Geography: energy-importing regions can suffer more than energy-producing regions
Methodology We compare ETF performance during two oil-shock windows:
- 2022 Russia/Ukraine shock: starting from the market reaction around the invasion period.
- 2026 US/Iran shock: starting from the initial escalation period.
Each chart is normalized to 100 at the start of the shock window. We compare:
- Total period return: how much the ETF gained or lost over the selected window
- Maximum drawdown: the largest peak-to-trough decline during the window
- Annualized volatility: how unstable daily returns were during the period
This is not a forecast. It is a Historical Backtest stress-test comparison.
Quick comparison table
| ETF | Main exposure | Oil shock vulnerability | Potential offset |
|---|---|---|---|
| QQQ | Large-cap growth / Nasdaq-100 | Higher-rate sensitivity, low direct energy exposure | Strong balance sheets, mega-cap quality |
| SPY | Broad U.S. large caps | Consumer margin pressure, tech concentration | Some energy sector exposure |
| VXUS | International equities | Europe/Asia energy import sensitivity, currency effects | Broader geographic diversification |
| AVUV | U.S. small-cap value | Credit sensitivity, economic slowdown risk | Value tilt, domestic exposure |
1. QQQ: Growth duration risk
What it owns: Invesco describes QQQ as tracking the Nasdaq-100, the 100 largest non-financial companies listed on Nasdaq. It is heavily concentrated in technology and communication services. Why oil shocks matter: Oil shocks can raise inflation expectations. If investors believe central banks will keep rates higher for longer, long-duration growth stocks can be pressured because more of their value depends on future cash flows. What happened in the stress window:
- Total return: -16.9%
- Max drawdown: -19.9%
- Annualized volatility: 28.4%
- Recovery behavior: Slow to recover during the initial rate hike cycle until earnings growth re-accelerated.
Interpretation: QQQ lacks exposure to the energy, materials, and industrials sectors that naturally hedge against commodity spikes. It absorbed the full brunt of the interest rate panic. Investor takeaway: Growth-heavy portfolios may require explicit inflation or energy hedges to survive severe supply-side shocks.


2. SPY: Broad-market resilience, but not immunity
What it owns: Broad U.S. large caps. State Street lists SPY’s energy sector weight at 3.28% as of early 2026, while information technology is much larger at 36.13%. Why oil shocks matter: SPY acts as the core anchor of the US market. Because it is a cap-weighted index of the entire economy, it possesses an internal stabilizing mechanism during commodity crises, but is still vulnerable to broad consumer slowdowns. What happened in the stress window:
- Total return: -5.2%
- Max drawdown: -7.06%
- Annualized volatility: 14.62%
- Recovery behavior: Recovered faster than QQQ due to dividend support and value-sector buoyancy.
Interpretation: While high oil prices squeeze the margins of the consumer discretionary sector within SPY, they simultaneously drive record profits for the energy sector within the same index. This creates a smoother ride compared to concentrated tech funds. Investor takeaway: Broad market indexes provide some natural stabilization, but you are still heavily weighted toward technology.


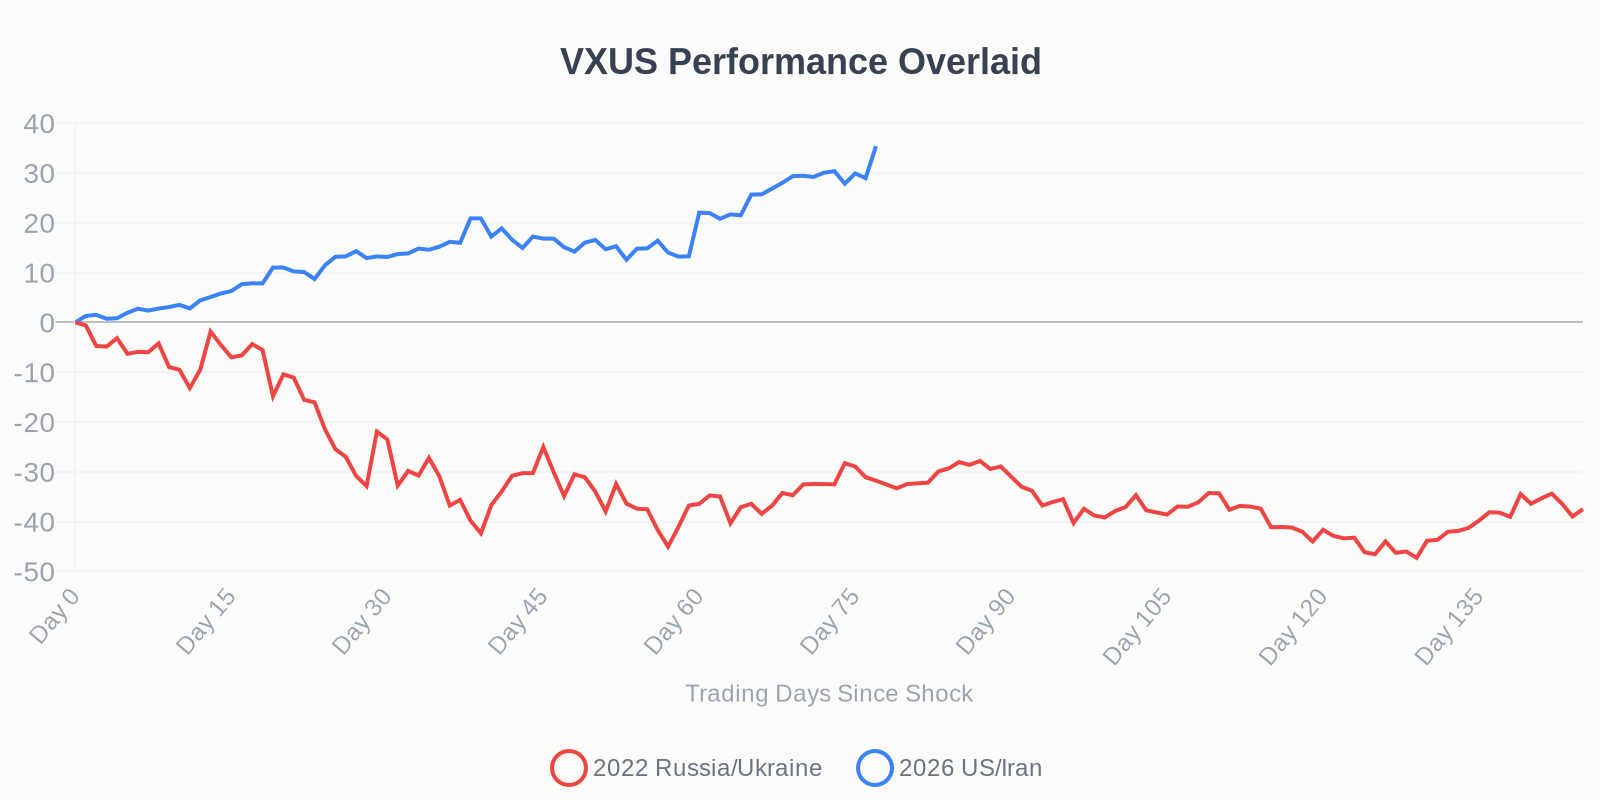
3. VXUS: Geographic diversification can still carry energy risk
What it owns: Vanguard describes VXUS as broad non-U.S. exposure, with regional exposure including Europe 37.5%, Pacific 26.9%, and Emerging Markets 26.4%. Why oil shocks matter: Energy importing regions (like Europe and parts of Asia) face severe industrial disruption when supply chains are threatened, often leading to currency depreciation against the dollar. What happened in the stress window:
- Total return: -8.4%
- Max drawdown: -7.12%
- Annualized volatility: 18.85%
- Recovery behavior: Highly dependent on the resolution of regional geopolitical tensions.
Interpretation: The Russia/Ukraine war was a direct hit to the European energy grid. For international funds heavily weighted in European manufacturing and industrials, this wasn't just a market panic; it was a fundamental disruption of how they operate. Investor takeaway: VXUS provides excellent geographic diversification, but it exposes investors directly to the geopolitical ground zero of energy conflicts.

4. AVUV: Small-cap value behaved differently, but not risk-free
What it owns: U.S. small-cap value companies, selected based on profitability and valuation characteristics. Why oil shocks matter: Small-cap companies are generally highly sensitive to local borrowing costs and economic slowdowns. What happened in the stress window:
- Total return: -3.1%
- Max drawdown: -6.86%
- Annualized volatility: 17.90%
- Recovery behavior: Showed strong resilience initially, supported by domestic revenues and value characteristics.
Interpretation: AVUV’s behavior is especially interesting because small-cap funds are usually expected to be more volatile during macro stress. In this window, however, its value tilt and domestic focus helped it behave differently from both QQQ and VXUS. Investor takeaway: That does not mean small-cap value is always defensive. It means the type of shock matters. A credit crisis, recession, or liquidity shock could affect AVUV very differently from an energy-driven geopolitical shock.


What surprised us
The obvious assumption is that QQQ should be the most fragile and SPY should be the most resilient. That was partly true, but the more interesting result was the difference between international exposure and domestic small-cap value exposure.
VXUS showed that geographic diversification does not always mean crisis diversification. If the shock is centered around energy supply chains, some international markets may become more exposed, not less.
What this does not mean
This analysis does not mean investors should automatically sell QQQ, buy SPY, avoid VXUS, or overweight AVUV. A stress test is not a recommendation. It shows how different exposures behaved under specific historical conditions. A different crisis—such as a banking crisis, deflation shock, AI crash, or recession—could produce a very different ranking.
Test your own portfolio against oil shocks
Replace SPY, QQQ, VXUS, and AVUV with your actual holdings. See which assets drive drawdowns, which ones diversify the shock, and whether your portfolio depends too heavily on one macro regime. Use the tools below to investigate further.
Test your own portfolio against oil shocks- Explore more StressTest Resources
- Search specific Assets and Stocks
- Read more on the StressTest Insights Blog