Market Post-Mortem: The Mechanics of an Oil Shock on SPY, QQQ, VXUS, and AVUV
Analyzing the historical resilience of core ETFs during major energy shocks and breaking down the mechanics of their drawdowns.
In the global economy, energy is the base-layer infrastructure. When oil prices experience a violent spike due to geopolitical conflict, the resulting inflation and supply chain friction act as a massive drag on corporate profits.
However, growth stocks, broad market indexes, international equities, and small-cap value funds all react to these inflationary spikes differently based on their sector weighting and geographic exposure.
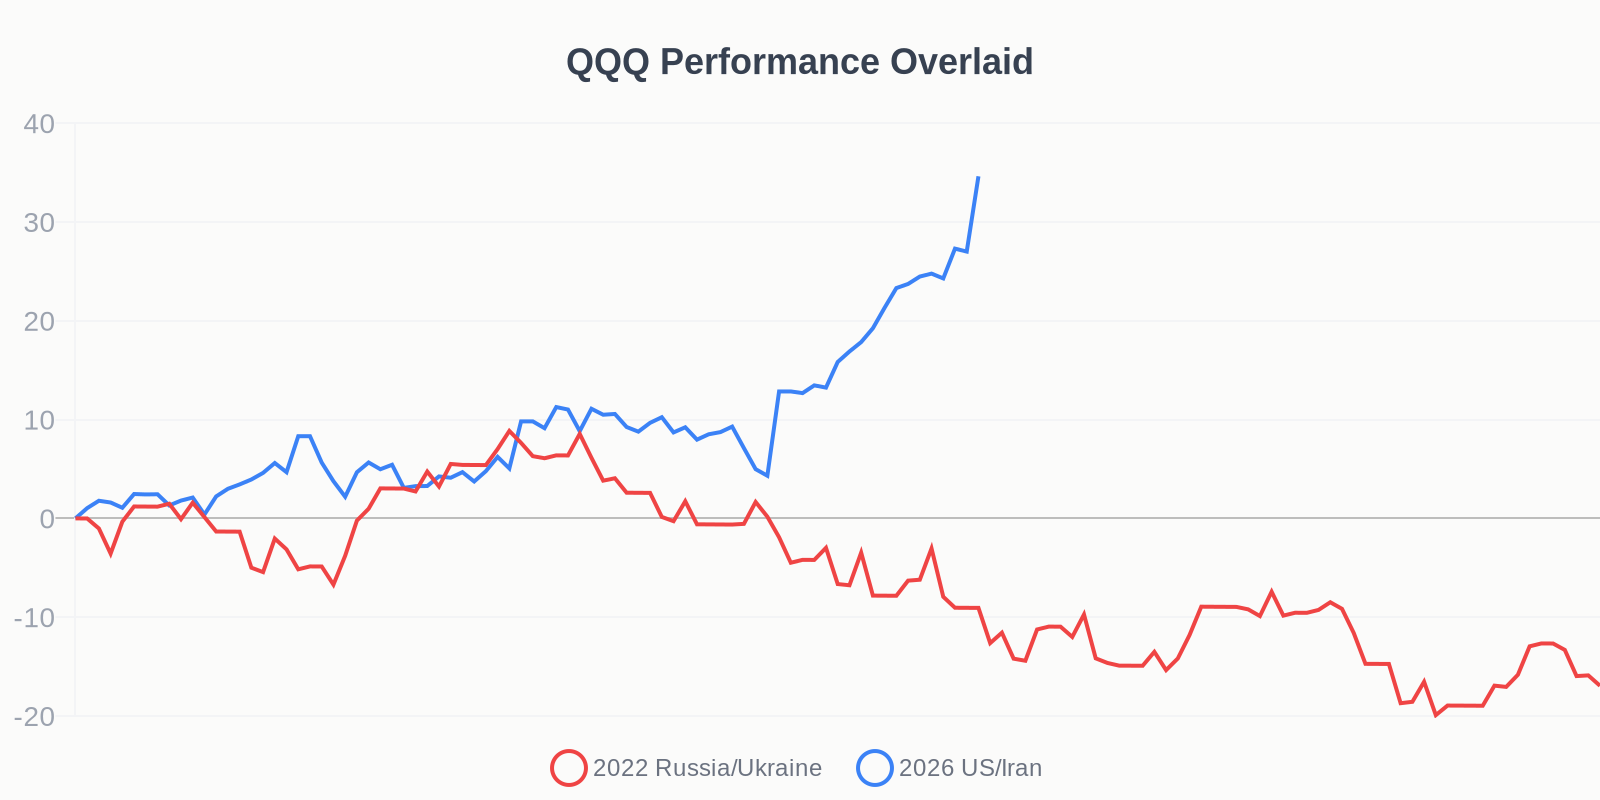
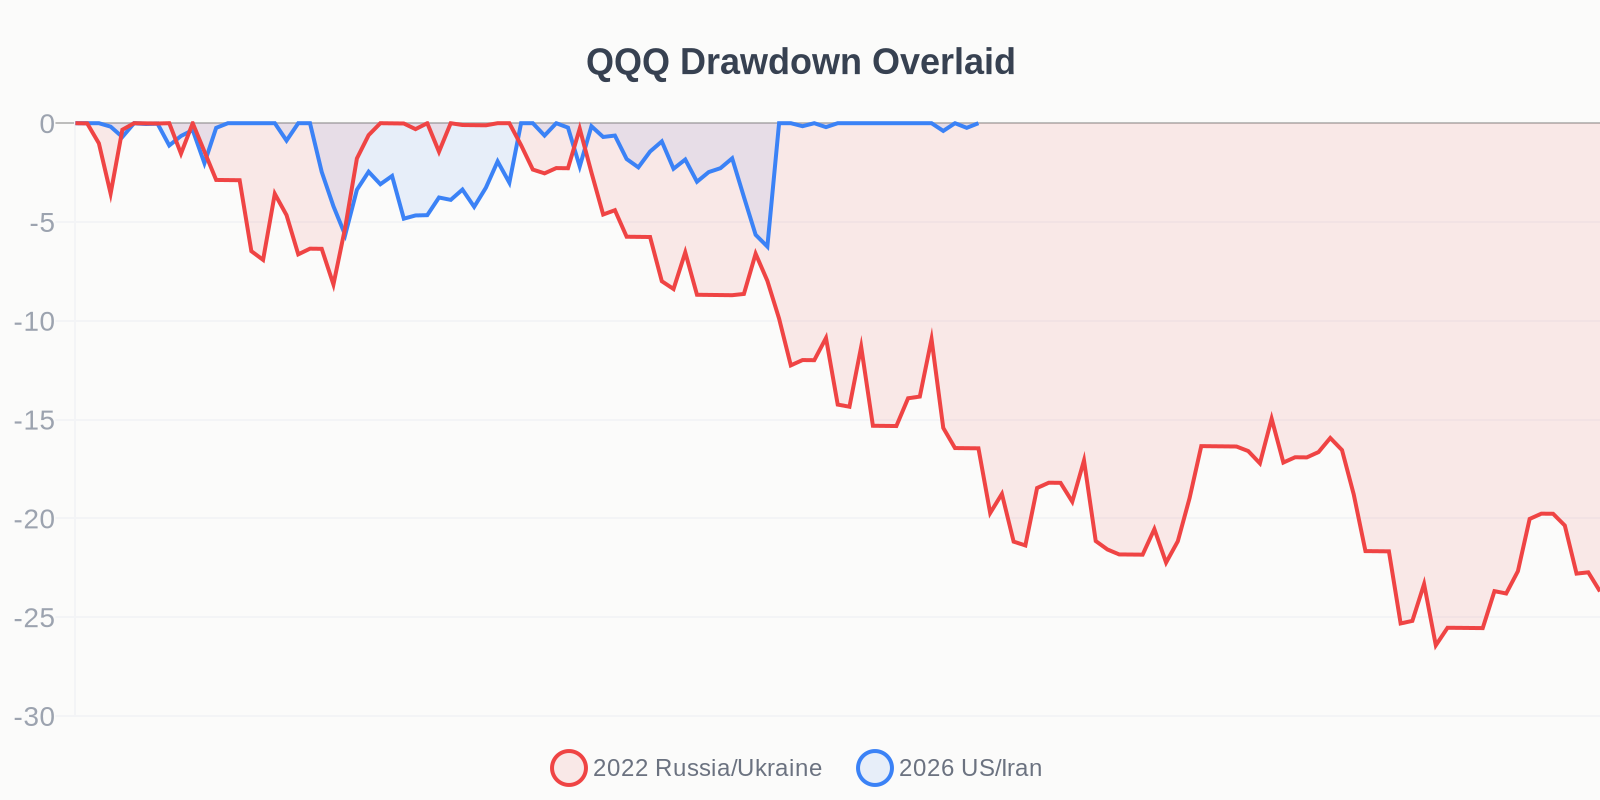
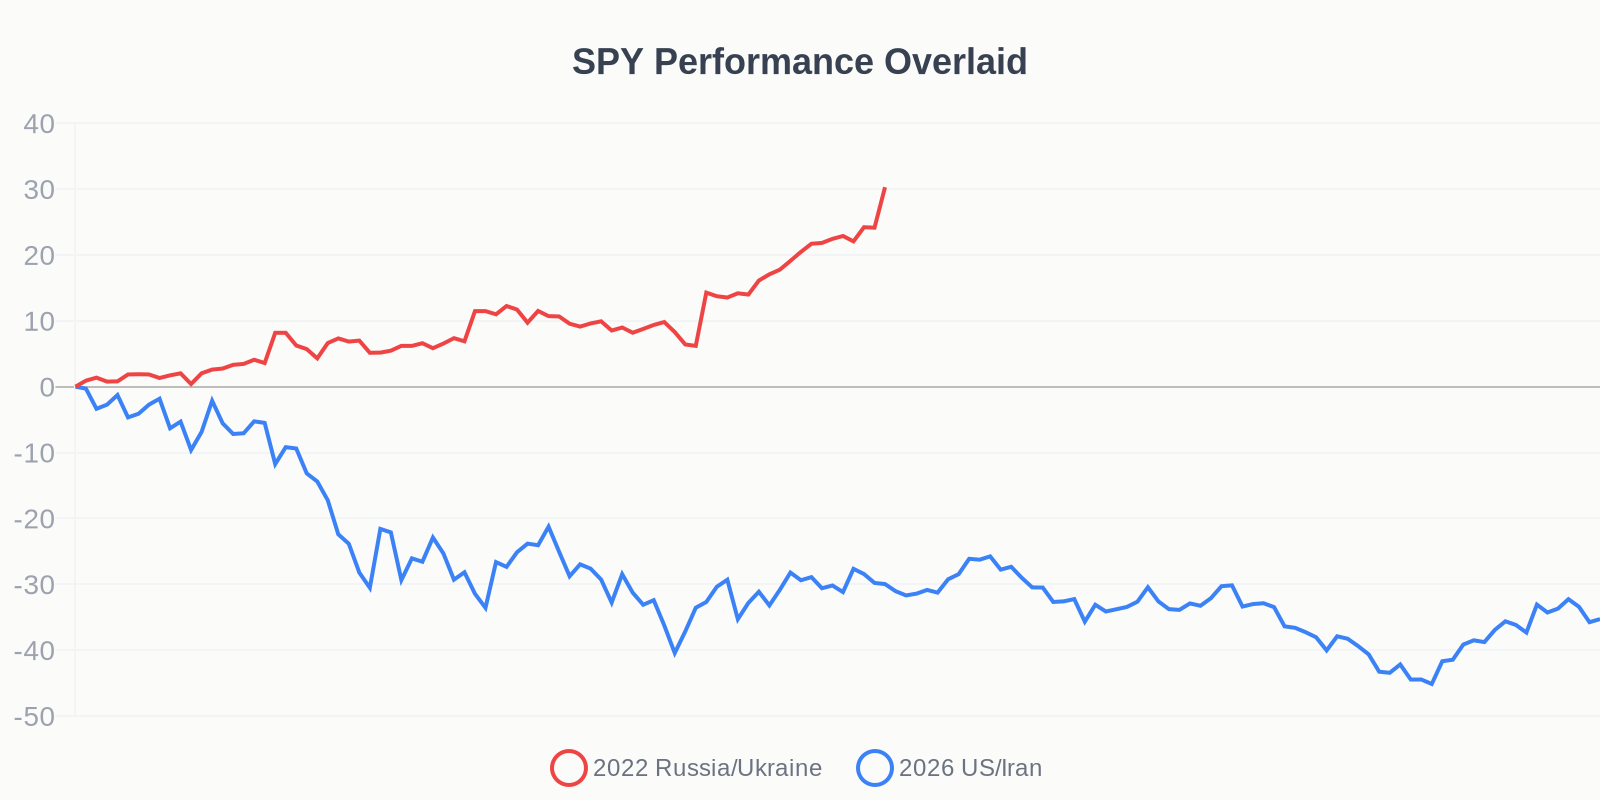
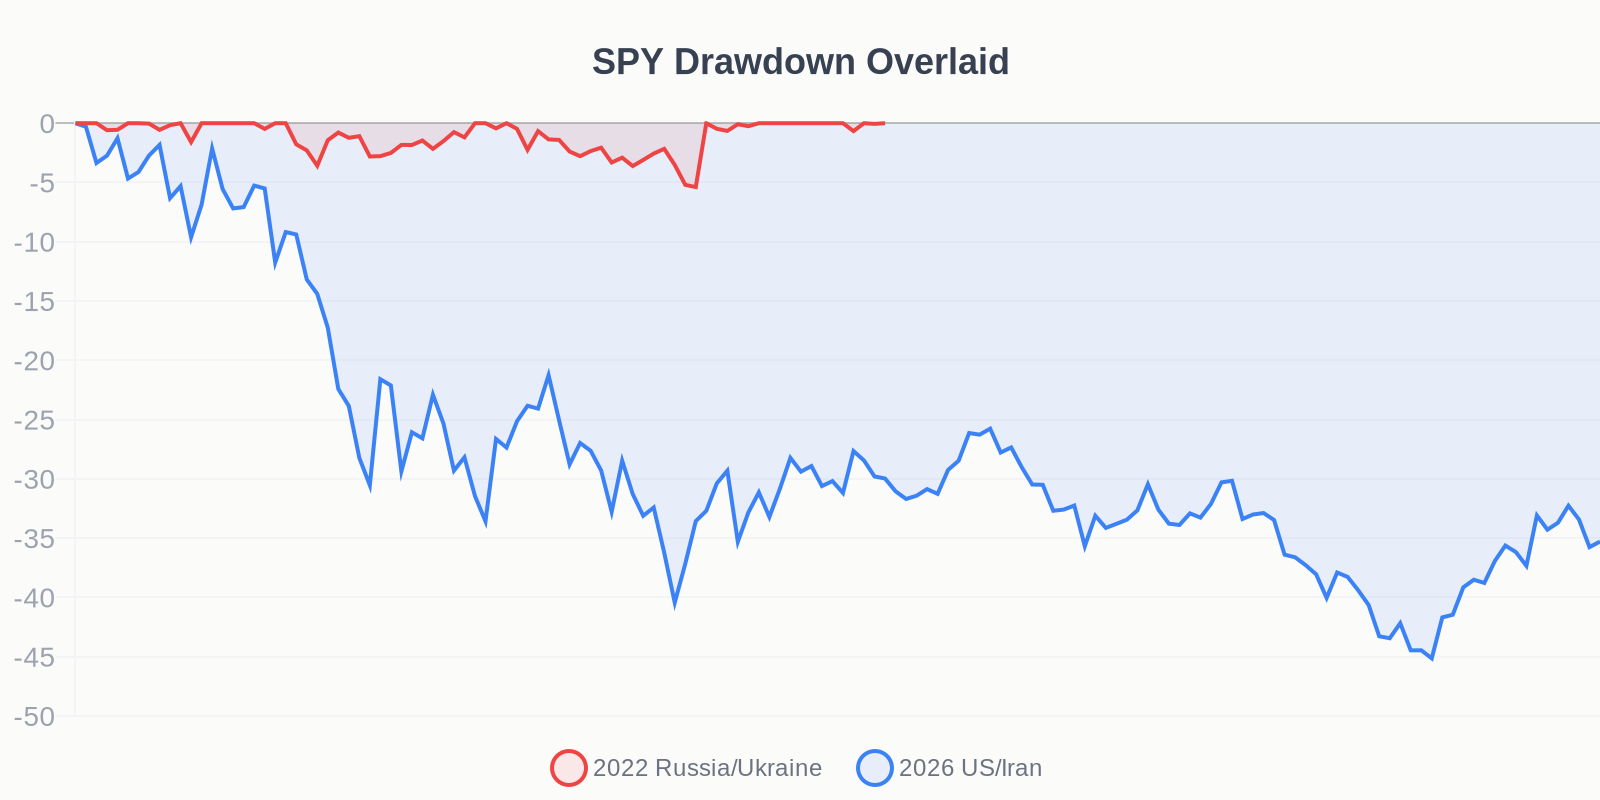
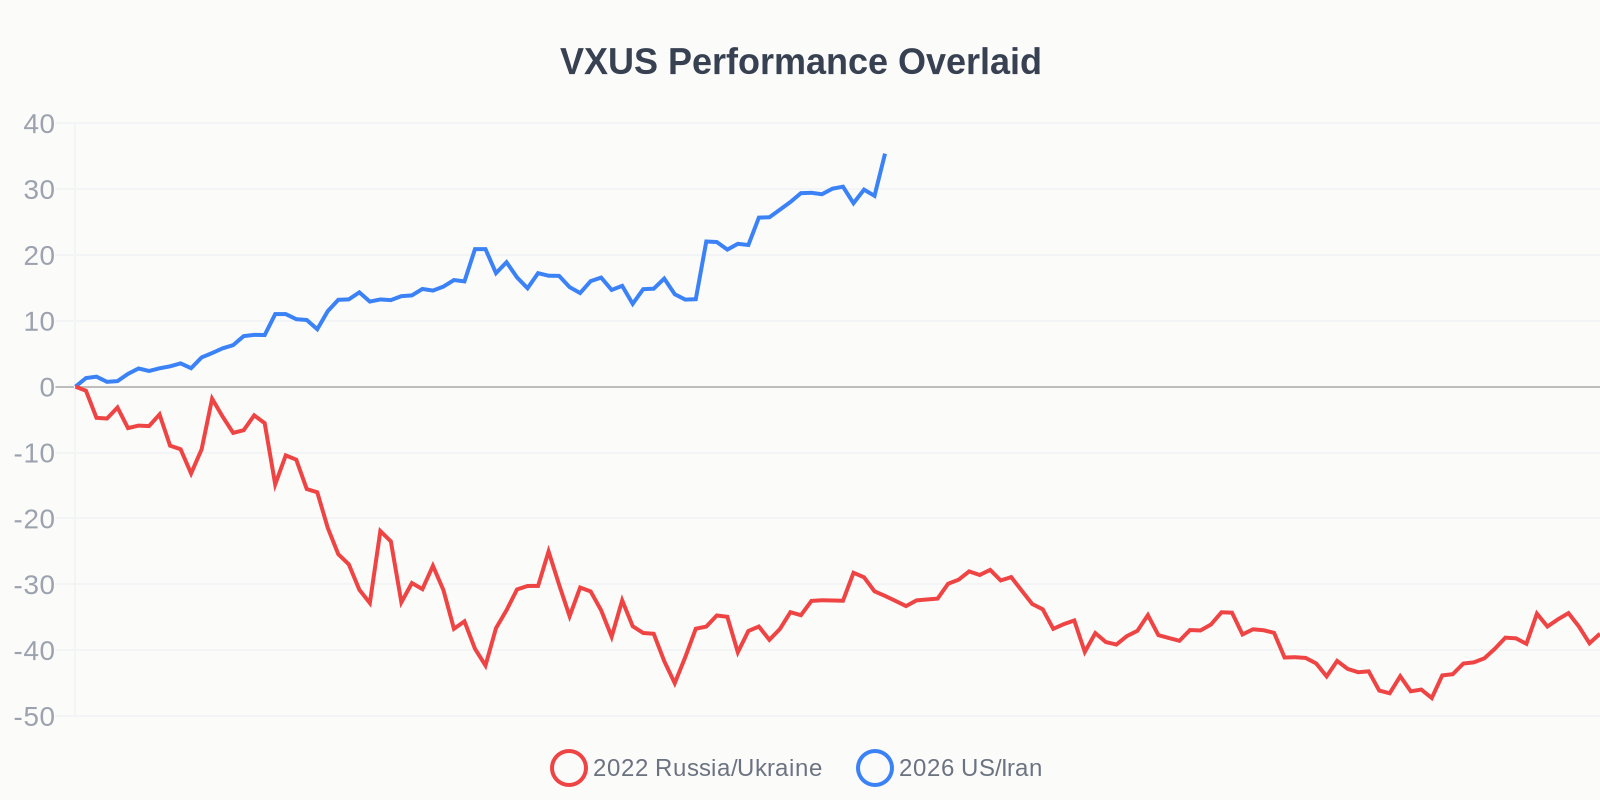
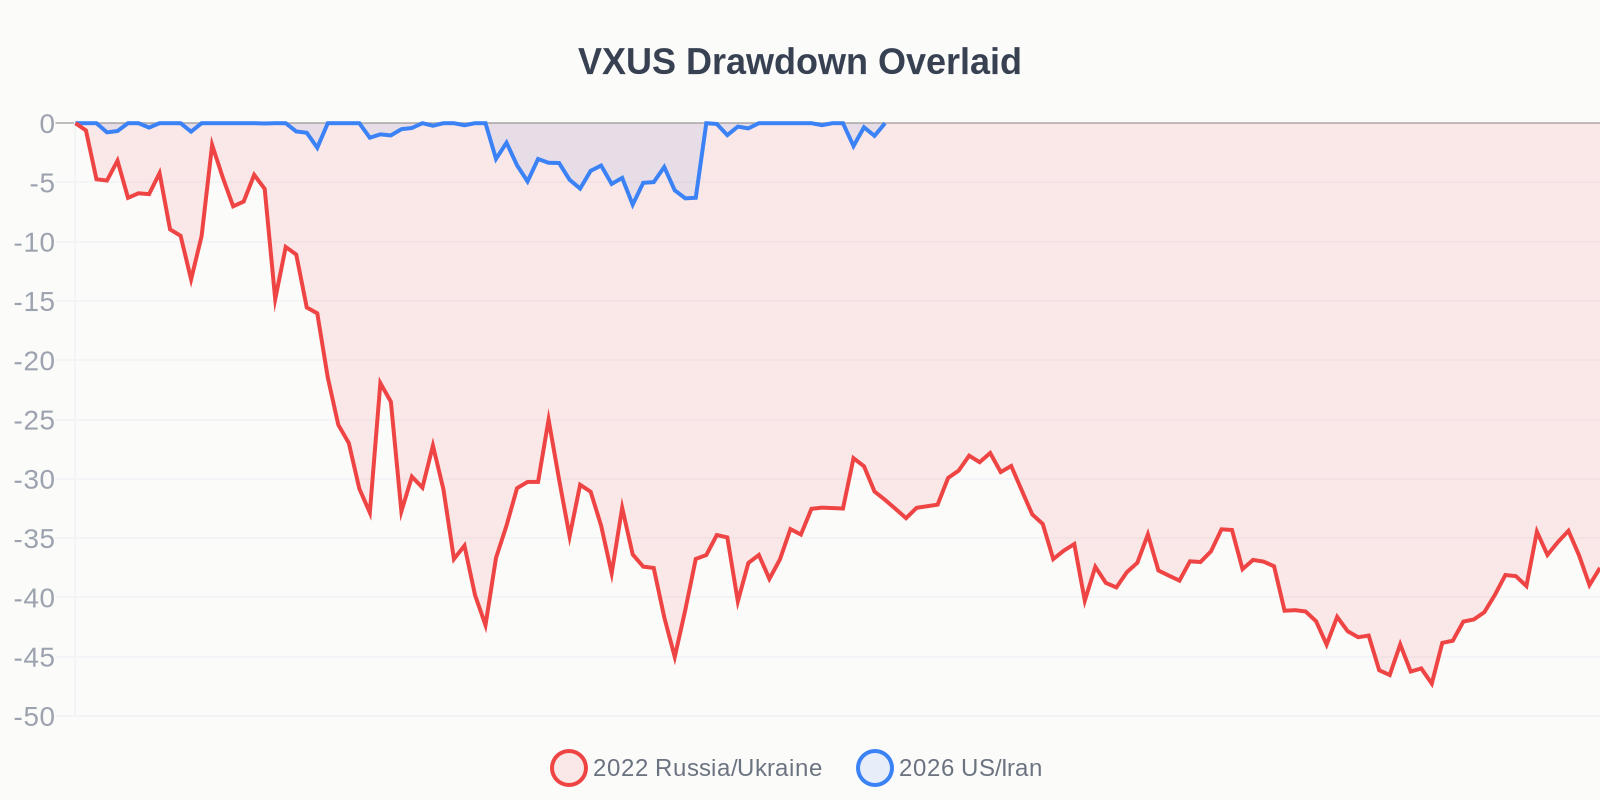
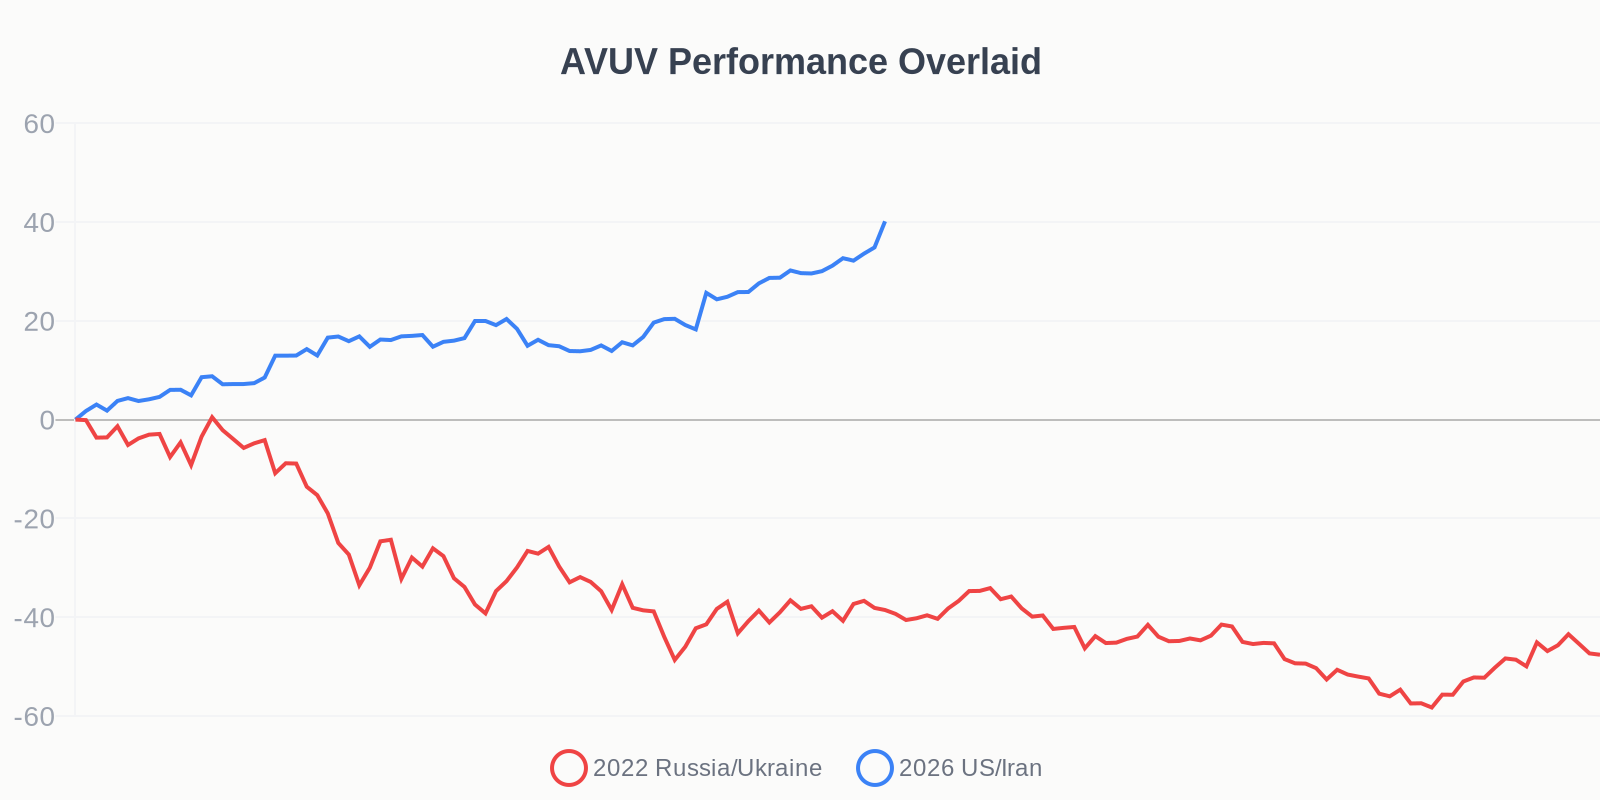
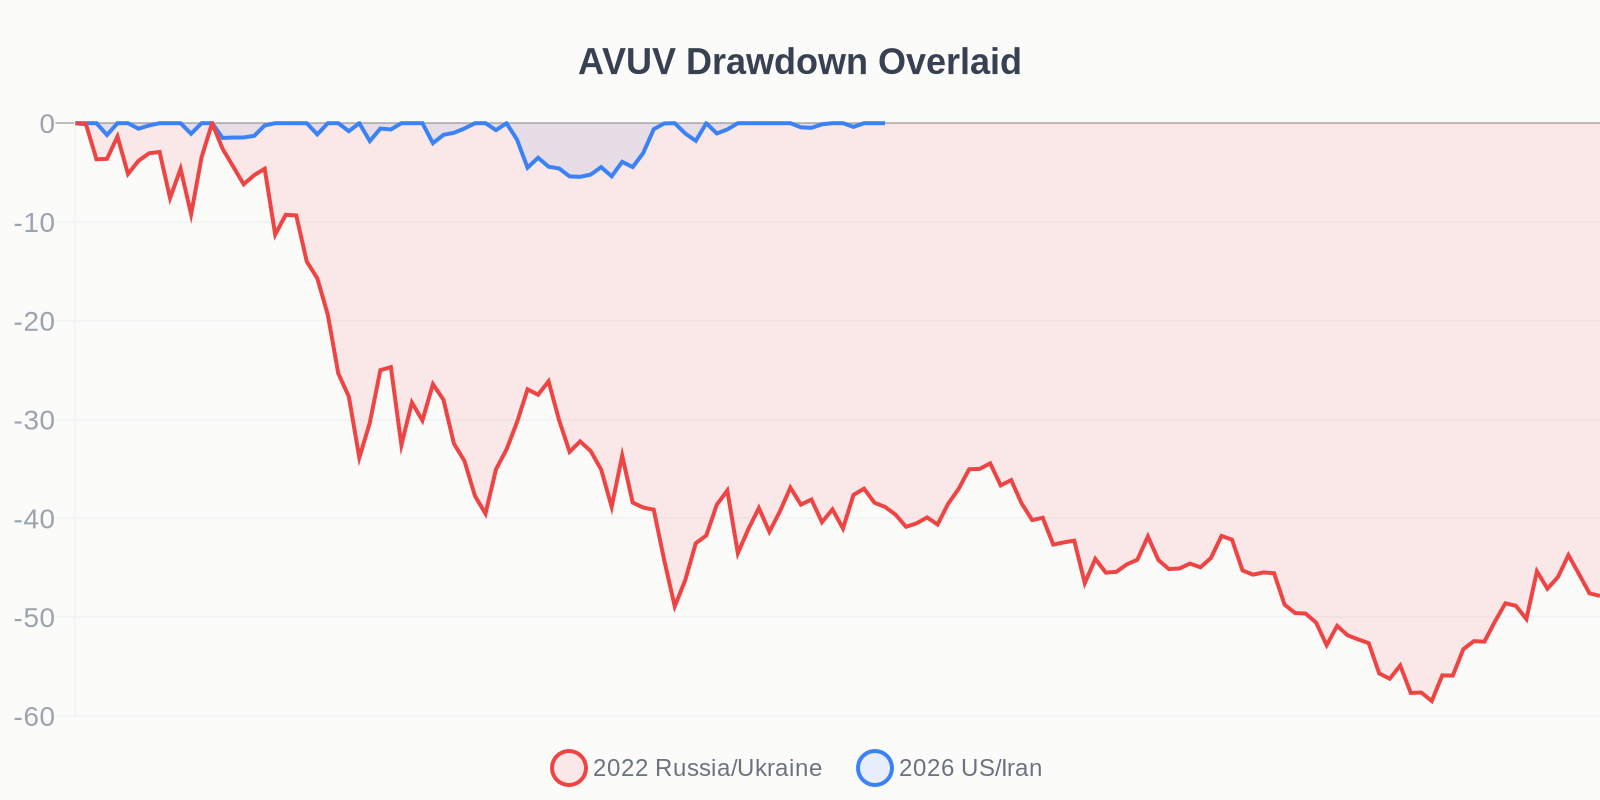
In this post-mortem, we analyze the historical resilience of four core ETFs—SPY, QQQ, VXUS, and AVUV—during major energy shocks, breaking down the mechanics of their drawdowns. The charts below overlay the performance and depth of drawdown for each ETF during the 2022 Russia/Ukraine shock (red line) versus the 2026 US/Iran shock (blue line), normalized from the onset of the crisis.
1. QQQ (Nasdaq 100): High Growth, High Sensitivity
Growth companies are valued based on their future cash flows. When an oil shock triggers inflation, central banks raise interest rates, making those future cash flows worth less today.
During the 2022 Russia/Ukraine energy crisis, we saw this mechanic play out violently.
- Max Drawdown: -19.9%
- Total Period Change: -16.9%
The Mechanic: QQQ lacks exposure to the energy, materials, and industrials sectors that naturally hedge against commodity spikes. It absorbed the full brunt of the interest rate panic.
2. SPY (S&P 500): The Built-In Energy Hedge
SPY acts as the core anchor of the US market. Because it is a cap-weighted index of the entire economy, it possesses an internal stabilizing mechanism during commodity crises.
- Max Drawdown: -7.06%
- Annual Volatility: 14.62%
The Mechanic: While high oil prices squeeze the margins of the consumer discretionary sector within SPY, they simultaneously drive record profits for the energy sector within the same index. This creates a smoother ride compared to concentrated tech funds.
3. VXUS (Total International Equity): The Geopolitical Ground Zero
VXUS provides an excellent look at geographic risk concentration.
- Max Drawdown: -7.12%
- Annual Volatility: 18.85%
The Mechanic: The Russia/Ukraine war was a direct hit to the European energy grid. For international funds heavily weighted in European manufacturing and industrials, this wasn't just a market panic; it was a fundamental disruption of how they operate. This resulted in the highest volatility profile among the assets tested.
4. AVUV (US Small Cap Value): The Value Premium Under Pressure
Small-cap value presents a unique dynamic. These smaller companies are mostly based in the US, but are highly sensitive to local borrowing costs.
- Max Drawdown: -6.86%
- Annual Volatility: 17.90%
The Mechanic: Despite the common assumption that small-cap stocks are inherently more chaotic, AVUV exhibited lower volatility than international equities and a tighter maximum drawdown than the S&P 500. Their domestic footprint insulated them from international supply chain chaos, highlighting the resilience of the "value premium" during global instability.
Run Your Own Post-Mortem
A robust portfolio requires an understanding of how your specific asset mix correlates during a crisis. Will your holdings act like QQQ or SPY during the next inflationary spike?
Further Analysis: Use the StressTest engine to build your exact portfolio and run it through our historical Black Swan scenarios.