AI Data Centers and the Power Grid: The Hidden Risk in Tech Portfolios
AI data centers are increasing electricity demand and exposing a hidden risk in tech-heavy portfolios. Learn how power-grid constraints, Utilities, Energy, and concentration risk connect.
The AI boom is usually described as a story about chips, cloud platforms, and software. But every model training run, inference workload, and GPU cluster depends on something much less glamorous: electricity.
That makes the power grid one of the most important hidden variables in the AI trade.
If an investor owns a tech-heavy portfolio through Nasdaq-100 exposure such as QQQ, they may already have significant exposure to the AI growth story. But they may not be thinking about the physical constraint behind that growth: data centers, transmission lines, natural gas supply, nuclear power, cooling systems, and utility capital expenditure.
This article looks at the AI infrastructure squeeze from a portfolio-risk perspective. The goal is not to predict which sector will win, but to show why investors should stress test how power demand, energy prices, interest rates, and grid bottlenecks could affect a tech-heavy allocation.
Key Numbers Behind the AI Power Grid Story
- Global data centers consumed about 415 TWh of electricity in 2024, around 1.5% of global electricity use.
- The IEA base case projects global data center electricity demand could reach around 945 TWh by 2030.
- U.S. data centers consumed about 176 TWh in 2023 and could rise to 325–580 TWh by 2028.
- DOE/LBNL estimates U.S. data centers used about 4.4% of U.S. electricity in 2023 and could reach 6.7%–12% by 2028.
- EIA expects U.S. electricity load to grow 1.9% in 2026 and 2.5% in 2027, with data centers helping drive that growth.
(Sources: IEA, DOE/LBNL, EIA Today in Energy)
Why AI Is Becoming an Electricity Story
The AI boom has two layers.
The first layer is the digital layer: chips, cloud platforms, software, models, and applications. This is the part investors usually see first.
The second layer is the physical layer: power generation, transmission lines, substations, cooling systems, land, water, permitting, backup power, and grid interconnection.
The risk is that these two layers do not scale at the same speed. A new AI application can scale globally in months. A new transmission line, power plant, or large grid connection can take years.
The New Bottleneck: Data Centers Can Scale Faster Than the Grid
In many regions, grid expansion has not kept pace with the speed of new large-load demand. The bottleneck is not only generation; it is also transmission, interconnection queues, transformers, permitting, and local grid capacity.
This massive divergence has created extreme valuation spreads. Tech valuations reflect high growth expectations, while infrastructure-linked sectors are priced around very different assumptions: regulation, commodity cycles, interest rates, and slower physical buildout.
 Chart: Total return comparison of QQQ, XLE, and XLU from Jan 2020 through May 2026. Past performance does not predict future results.
Why This Matters for Tech-Heavy Portfolios
Investors with a tech-heavy portfolio may be more exposed to this assumption than they realize: that the physical energy grid can support rising AI demand without major delays, cost increases, or reliability issues.
This article does not argue that Energy or Utilities are automatic winners. Instead, it shows why investors with heavy AI or QQQ exposure should test how power-grid constraints, higher energy costs, and infrastructure bottlenecks could affect portfolio risk.
Is the AI Power Grid Risk Already Priced In?
This is the central investing question. If markets already expect data center power demand to grow, then Utilities, Energy, and grid infrastructure stocks may already reflect part of that optimism.
That is why this article does not treat Energy or Utilities as automatic winners. Instead, it frames them as different exposures: QQQ captures the digital AI layer, XLU captures part of the regulated electricity delivery layer, and XLE captures part of the fuel and energy supply layer.
The useful exercise is not prediction. It is comparison.
K-Factor Lens: How QQQ, XLU, and XLE Behave Differently
In StressTest.pro, K-Factors are the major risk lenses used to understand what is driving a portfolio, such as growth exposure, valuation sensitivity, rate sensitivity, commodity exposure, and defensive behavior.
Instead of asking “which ETF will win?”, a better question is: “what risk factors does each ETF add to a portfolio?”
| Lens | QQQ | XLU | XLE | Why It Matters |
|---|---|---|---|---|
| Growth exposure | High | Low/Moderate | Low/Moderate | QQQ is more directly exposed to AI earnings expectations. |
| Valuation sensitivity | Higher | Moderate | Cyclical | Expensive growth stocks can be vulnerable to multiple compression. |
| Rate sensitivity | Moderate | High | Mixed | Utilities can be pressured when rates rise. |
| Commodity exposure | Low | Low | High | XLE depends heavily on energy prices, not just data center demand. |
| Defensive behavior | Lower | Higher | Mixed | XLU may reduce volatility, but it is not guaranteed protection. |
| AI infrastructure link | Direct digital layer | Grid/power delivery | Fuel/power supply chain | Each exposure captures a different part of the AI stack. |
The Stress Test: What Happens If the AI Trade Faces Higher Power Costs?
Beyond the structural growth story, Utilities and Energy offer something Tech currently lacks: different correlation and drawdown profiles. During periods of severe market stress, high-beta tech stocks suffer deep drawdowns.
 Chart: Historical drawdown profile of QQQ, XLE, and XLU from Jan 2020 through May 2026. Past performance does not predict future results.
Testing different allocations to Energy and Utilities can show how portfolio risk changes, especially during periods when the Tech sector is drawing down. Utilities can sometimes behave differently from high-growth tech stocks because of their regulated cash flows and dividend profile, but they should still be tested rather than assumed to provide protection.
 Chart: 63-day rolling annualized volatility of QQQ and XLU from Jan 2020 through May 2026. Past performance does not predict future results.
In some periods, these sectors have shown lower correlation to QQQ, which can change the overall portfolio risk profile. But correlation is not stable, so it should be tested rather than assumed.
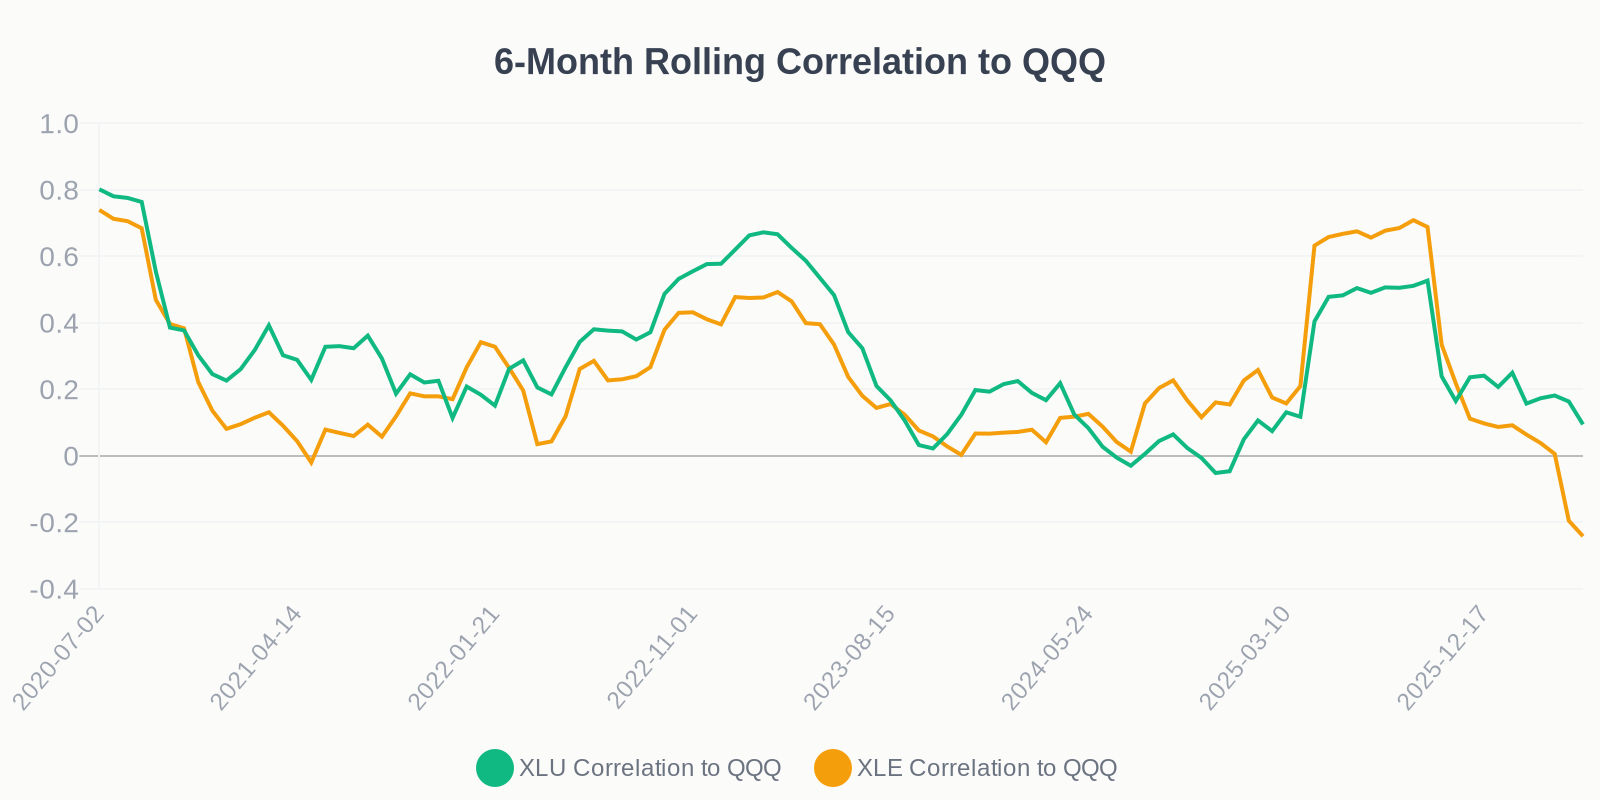 Chart: 126-day rolling correlation of XLE and XLU to QQQ from Jan 2020 through May 2026. Past performance does not predict future results.
The Counterargument: Why This Trade Is Not Obvious
Why Utilities Are Not a Free Lunch
Utilities are not risk-free. They can be sensitive to interest rates, regulation, debt costs, and capital expenditure cycles. If utilities must spend heavily on grid upgrades, the benefit to shareholders may depend on whether regulators allow them to earn attractive returns on that investment.
Why Energy Is Not a Pure AI Trade
Energy is also not a pure AI infrastructure trade. XLE is heavily influenced by oil and gas prices, global supply, OPEC decisions, geopolitics, and commodity cycles. A data center power boom does not automatically translate into higher returns for every energy company.
Tech also has offsets. AI hardware may become more energy efficient, hyperscalers may sign long-term power contracts, and some data centers may locate near cheaper power sources. So the risk is not simply “AI fails because electricity is scarce.” The better question is: how much of this risk is already priced into different sectors?
How to Test This in Your Own Portfolio
If your portfolio is concentrated in large-cap technology or AI-related stocks, the key question is not only “will AI grow?”
A better question is:
- What happens if tech valuations compress?
- What happens if energy prices rise?
- What happens if Utilities outperform during a defensive market?
- What happens if Energy adds commodity risk instead of reducing risk?
- Does adding XLU or XLE improve drawdowns, or does it simply change the type of risk?
Use StressTest.pro to compare a tech-heavy portfolio against portfolios that include Energy, Utilities, or broader market exposure. Review historical drawdowns, volatility, factor exposure, and risk-adjusted returns before making any allocation decision.
Stress Test an AI-Heavy PortfolioFAQ
Why do AI data centers need so much electricity?
AI workloads require large clusters of GPUs, networking equipment, cooling systems, and backup power. As AI usage grows, data center electricity demand can rise alongside model training and inference demand.
Are Utilities a good way to invest in AI infrastructure?
Utilities may benefit from rising electricity demand, but they also face interest-rate, regulation, debt, and capital expenditure risks. They should be analyzed as a risk factor, not treated as a guaranteed AI winner.
Is Energy a direct AI investment?
Not directly. Energy companies may benefit from higher power demand, but Energy ETFs are also affected by oil prices, gas prices, geopolitics, and commodity cycles.
What is the hidden risk for tech-heavy portfolios?
A tech-heavy portfolio may be exposed to valuation risk, concentration risk, and the possibility that AI infrastructure costs rise faster than expected.
How can I test AI power-grid risk in my portfolio?
You can compare portfolios with different allocations to Tech, Utilities, Energy, and broad-market ETFs, then review drawdowns, volatility, correlation, and risk-adjusted returns.
Final Takeaway
The AI boom cannot exist in a vacuum. Large-scale AI infrastructure depends on reliable power, cooling, grid capacity, and long-duration physical investment. For investors, the key lesson is not that Utilities or Energy will automatically win. The key lesson is that a tech-heavy portfolio may carry hidden exposure to electricity costs, grid delays, valuation risk, and infrastructure bottlenecks.
Stress testing those scenarios can help investors understand whether their portfolio is truly diversified, or simply concentrated in a different part of the same AI trade.
- Explore more StressTest Resources
- Search specific Assets and Stocks
- Read more on the StressTest Insights Blog
Fund Documentation
Related StressTest.pro Analysis
- QQQ Deep Dive & Factor Risk
- XLE Deep Dive & Factor Risk
- XLU Deep Dive & Factor Risk
- StressTest.pro Backtest Engine
Disclaimer: This article is for educational purposes only and does not provide personalized investment, tax, or financial advice.